Pricing homes correctly is 90% of the process!
Casey prices every home. He compare your home to:
- Website Zestimates
- Tax Assessments
- Neighborhood comps of homes of similar size, age and condition
- 1 Mile radius comps of homes of similar size, age and condition
3 Casey Samson Models compare appraisal qualifying comps in your neighborhood, within a neighborhood, one mile radius and the potential pricing threshold.
If the home was purchased within the last 10 years, we do a 4th model: a 10 year growth chart.
View More:![]()
Rule #1: Well Priced Homes Sell at Maximum Value
Rule #2: Don’t Forget Rule #1
Time is Money When Selling your Home
Homes get the max value in the first 30 days!
There are 3 basics places to get pricing on a home.
The least accurate is Website estimates but you need to know what the buyers are looking at.
A good indicator is a percentage of the local tax assessment
The most accurate is the Casey Samson Pricing Model which compares Price per sq ft and % of assessment similar age and size homes sold within:
- The Neighborhood
- 1 mile in the last 120 days. These are the appraisers comps.
- Target threshold
- Growth chart showing a 10 year growth of similar homes.
Website estimates mislead buyers & sellers
On a sample home in Vienna, Virginia here are the website estimates:
- Realtor Property Resource: $1.1M
- Home Snap: $1.104M
- Trulia: $905,000
- Zillow: $919,000
Estimates/Zestimates are national algorythms that can vary 20% or more on a single property.
This is a huge contributing factor why sellers and Realtors over price homes. 40% of the homes in Northern Virginia withdraw unsold.
Tax assessors are a consistent source in determining the value of a home
Tax assessors give us a “ballpark” price of a home. Historically homes within a one mile radius with similar age and size will sell at a consistent percentage of assessment i.e. 108% – 110% of assessed value. There are other mitigating factors that must be considered, however, when determining the value of a home.
Casey Samson’s pricing model has a proven track record of putting an accurate value on home as evidence by his portfolio of selling at 100.1% of list price.
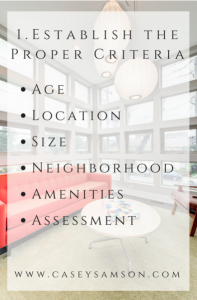 Step One – Establish The Proper Criteria
Proper Comparables are based on age, type of home, size and similar features. Credibility is given to same neighborhood, same street. In other words this is where we compare apples to apples. Each area has sub markets as a defining characteristic. Vienna is defined by elementary schools. Falls Church and Centreville are defined by High Schools
Step Two – Compare
Price per square feet (PPSF)
% of assessment
Step Three – Adjust
- Size
- Lot
- Upgrades
- Condition
The model includes:
- Range of Percentages based on sale price vs county assessment
- Range of Price per sq ft (PPSF)
- Produce “The Index which is a combination of the two numbers”
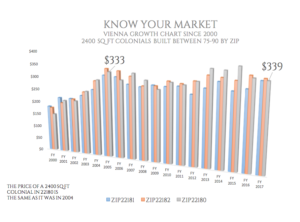 Step Four – Confirm PPSF using growth charts.
Growth charts show 10 year pricing cycle.
Growth Charts also confirm the history of the PPSF.
Step Five – Evaluate Market Conditions.
- How many active competitors do you have?
- How many competitors are under contract?
- Home many competitors sold in the last 120 days?
- What is the average days on market for this neighborhood?
- What is the average price of homes within one mile?
- What type of leverage does the seller have?
Step Six – Apply Thresholds
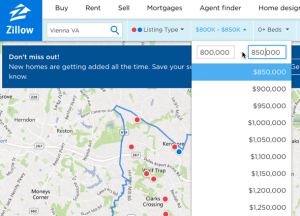 Buyers search for homes based on a minimum and maximum price. Example searches:
Buyers search $750,000-$800,000 so you would not list a home at $810,000. We would list at $800,000 to compete against an weaker price group. If the home is worth more, the home will receive multiple contracts and push the price up.
Buyer search $500,000-$550,000 so you would not list at $555,000. You would list at $550,000
Our goal is to produce multiple contracts which allows our sellers maximum leverage in negotiating contracts and inspection releases.
If you misprice your home, this is what may happen:
One neighbor gets $74,000 more than her neighbor for same size, age and condition property.
This is what happens when sellers do it RIGHT:
- Home listed at $875,000
- Home receives one contract for $875,000 in first weekend
- Buyer was told highest and best offer
- Buyer raised their offer to $917,000. (They were bidding against themselves)
- The home inspection was waived.
- The home appraised for $875,000 but the contract called for buyer to pay anything over list price
- Seller walked with $917,000
This is what happens when you do it WRONG:
- Home was listed for $925,000. $50,000 over recommended list price
- Home sat on the market for 6 months
- Home sold for $855,000
- Home inspection resulted in $12,000 of repairs
- Net to seller: $843,000 or $74,000 less than their neighbor
Seller loses $57,000.
Don’t let this happen to you!
- Traffic and comments lead to a recommendation to move price under $1M
- Price reduced to $1.05M
- Offer of $995,000 is rejected
- Home withdrawn
- Home resisted
- Home SOLD for $938,000
- Seller loses $57,000